new
New in 4.3.5
New Properties panel
This release we've changed the way we present node properties. Until now, properties have been displayed in a relatively small area at the bottom of the graph visualisation. We've heard your feedback and suffered the same frustrations ourselves trying to view property-rich nodes in this space.
From this release, properties are now presented in their own dedicated panel. We've also moved the Overview, which was previously split between the top and bottom, to this panel. This Overview will show when you have no nodes selected or hovered. It itemises the labels and types present in the current graph visualisation and allows you to restyle them:
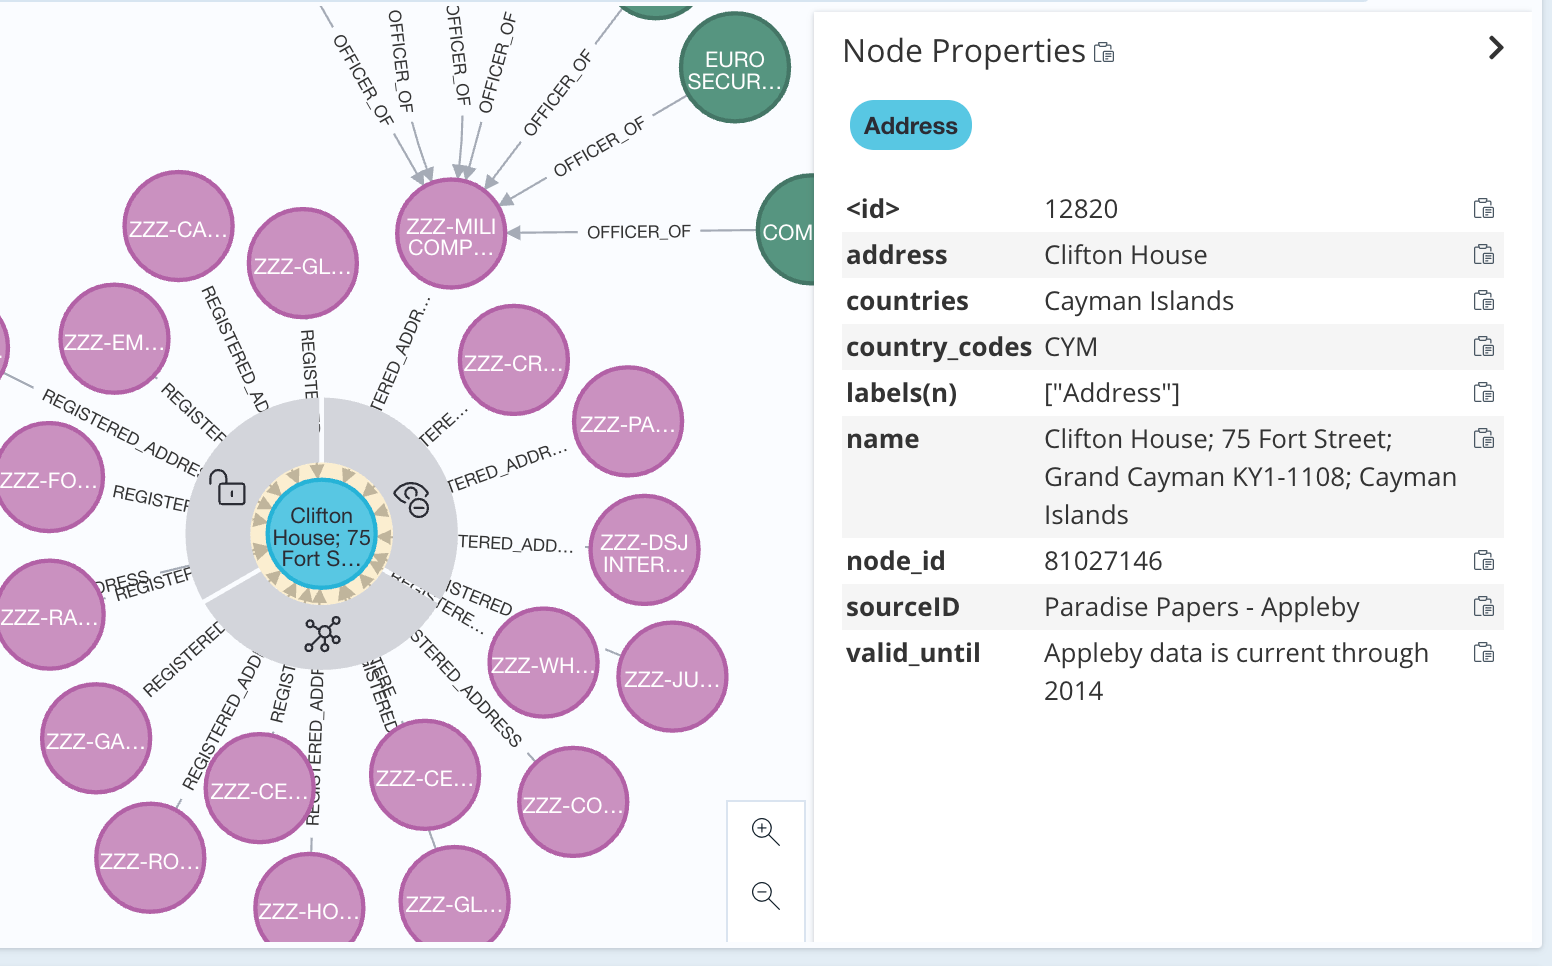
When you hover or select a node or relationship, its properties are displayed in the panel. You can also change styling from this view, just as you can in the Overview:
The panel itself can be collapsed or resized if you need to give more or less space to the graph visualisation. The panel's last expand/collapse state will be remembered and subsequent result frames will observe that latest state, ensuring the panel is where you need it to be.
The property names and values can be copied individually or in bulk for use elsewhere:
And finally, to help you understand the data type of a property, hovering a property will reveal its type.
Help make Browser better
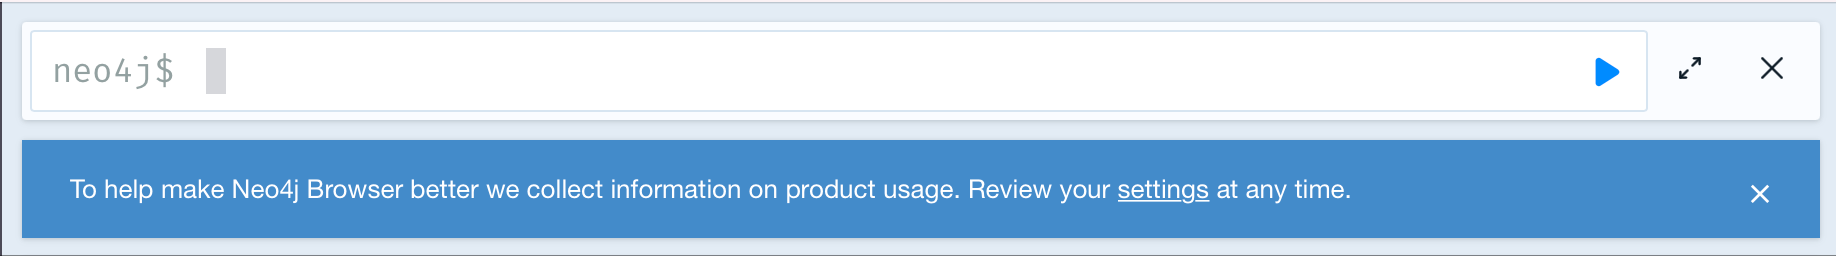
We've optionally been collecting product analytics data from our Browser users running in Neo4j Desktop for some time and we're now rolling this out more widely to other areas you may run Browser. When you run Neo4j Browser outside of Desktop for Aura, you'll now be informed that you're opted into product analytics. This helps us make Browser better, but you will of course be given the option to opt out. When running in Desktop and Aura, product analytics settings will continue to be managed by those applications.
We hope you enjoy this latest release and as always look forward to hearing your feedback.